How to Read Crypto Charts for Beginners

Crypto charts display how cryptocurrency prices have changed over time. One of the most crucial trading and investing skills for novices is the ability to read these charts.
This guide explains the basics of crypto chart analysis in simple terms.
Types of Crypto Charts
1. Line Chart
Shows the closing price over time. Best for a quick market overview.
2. Bar Chart
Displays opening, closing, high, and low prices.
3. Candlestick Chart
The most popular type, showing detailed price movement.
Understanding Candlesticks
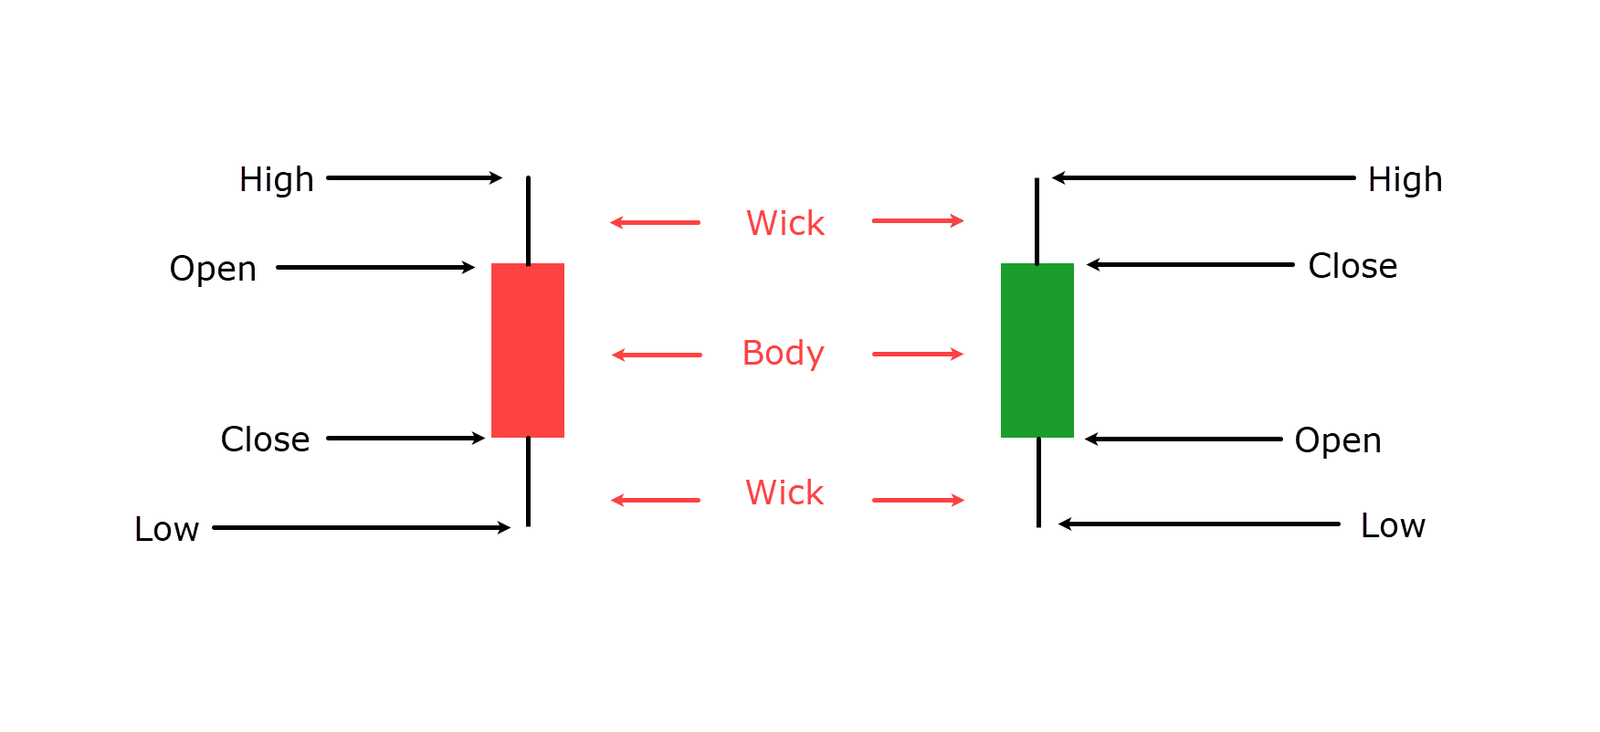 Each candlestick shows:
- Open price
- Close price
- High price
- Low price
Green candle = price increased
Red candle = price decreased
Time Frames
Charts can be viewed in:
- 1 minute
- 5 minutes
- 1 hour
- 1 day
- 1 week
Short time frames = short-term trading
Long time frames = long-term investing
Key Chart Concepts
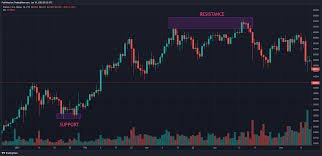
Support & Resistance
- Support: price level where buying interest is strong
- Resistance: price level where selling pressure appears
Trends
- Uptrend: higher highs and higher lows
- Downtrend: lower highs and lower lows
- Sideways: stable price range
Popular Indicators for Beginners
- Moving Averages (MA)
- Relative Strength Index (RSI)
- Volume
These indicators help predict future price movement.
Simple Trading Strategy
- Identify the trend
- Mark support & resistance
- Confirm with RSI & volume
- Enter trade
- Set stop-loss & take-profit
Common Beginner Mistakes
- Overtrading
- Ignoring trends
- Trading without a plan
- Emotional decisions
Conclusion
Gaining proficiency with cryptocurrency charts lowers risk and boosts confidence. Beginners can become proficient traders and make wise choices with discipline and practice.


")
